
Quality of Employment Framework

​In 2015, the Conference of European Statisticians endorsed a statistical framework, developed by the Expert Group on Measuring Quality of Employment and published in the Handbook on Measuring Quality of Employment. It provides a theoretical framework and detailed practical guidance for countries that wish to produce statistics on measuring quality of employment.The framework represents a neutral and comprehensive approach to assess quality of employment in its multiple facets. It defines 67 indicators on seven dimensions (which are partly divided into sub-dimensions) that address employment quality from the perspective of the employed person.

handbook on measuring quality of employment

Handbook on Measuring Quality of Employment 

Quality of Employment Framework_Diagrame.png

To view the subdimensions and specific indicators under each, please click on the dimensions below.  

1. Safety and ethics of employment

Subdimension a) Safety at work
1a1 Fatal occupational injuries
1a2 Nonfatal occupational injuries
1a3 Exposure to physical health risk factors
1a4 Exposure to mental health risk factors

Subdimension b) Child labour and forced labour
1b1 Child labour rate
1b2 Hazardous child labour rate
1b3 Forced labour rate
1b4 Forced labour among returned migrants
1bx Other worst forms of child labour (experimental)

Subdimension c) Fair treatment in employment
1c1 Pay gap
1c2 Access to managerial occupations
1c3 Discrimination at work

2. Income and benefits from employment

Subdimension a) Income from employment
2a1 Average earnings
2a2 Employees with low pay
2a3 Earnings by deciles
2a4 Employment-related income of self-employed

Subdimension b) Non-wage pecuniary benefits
2b1 Paid leave entitlement
2b2 Days of paid leave entitlement
2b3 Actual days of paid leave
2b4 Sick leave entitlement
2b5 Days of sick leave entitlement
2b6 Actual days of sick leave

3. Working time and work-life balance

Subdimension a) Working hours
3a1 Mean weekly working hours
3a2 Long working hours
3a3 Involuntary part-time work
3a4 Distribution of weekly working hours
3a5 Multiple job holders

Subdimension b) Working time arrangements
3b1 Night work
3b2 Evening work
3b3 Weekend work
3b4 Flexible work schedules

Subdimension c) Work-life balance
3c1 Employment rate of mothers and fathers
3c2 Possibility to work at home
3c3 Commuting time
3c4 Care leave entitlement
3c5 Parental leave
3cx Child care use (experimental)

4. Security of employment and social protection

Subdimension a) Security of employment
4a1 Fixed-term contracts
4a2 Job tenure
4a3 Own account worker
4a4 Self-employed with one client
4a5 Perceived job security
4a6 Temporary employment agency workers
4a7 Lack of formal contracts
4ax1 Precarious employment (experimental)
4ax2 Informal employment (experimental)

Subdimension b) Social protection
4b1 Pension insurance coverage
4b2 Unemployment insurance coverage
4b3 Medical insurance coverage

5. Social dialogue

5.1 Collective bargaining coverage rate
5.2 Trade union density rate
5.3 Days not worked due to strikes and lock-out
5.x Employer organization density rate (experimental)

6. Skills development and training

6.1 Training participation
6.2 Volume of training
6.3 Usefulness of training
6.4 Learning at work
6.5 Employability
6.6 Skills match

7. Employment-related relationships and work motivation

Subdimension a) Employment-related relationships
7a1 Relationships with co-workers
7a2 Relationship with supervisor
7a3 Employment-related violence

Subdimension b) Work motivation
7b1 Job autonomy
7b2 Feedback from supervisor
7b3 Intrinsic rewards
7b4 Work intensity
7b5 Organizational participation


International comparison of results 

Some countries have already implemented statistics on the quality of employment. The below table illustrates an example of internationally comparable results that are compiled by several countries for indicators 3a5 and 3b1 under Dimension 3: Working time and work-life balance. 

3a5 Multiple job holders

This indicator describes the share of employed persons who have more than one job (as employee or self-employed) in all employed persons aged 15+ years. The recommended source to use is a household-based Labour Force Survey (LFS). Methodological information on the indicator results can been seen here. 

test

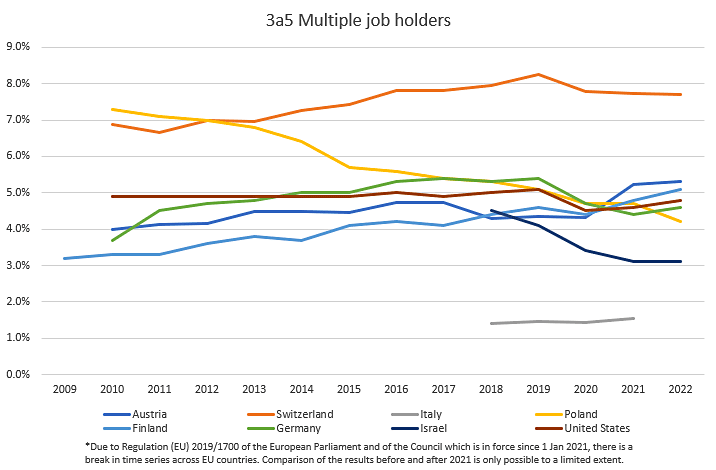
To work in more than in one job may indicate that the earnings of one job are not enough to make the ends meet (especially in case the main job is part-time and/or in certain ISCO-groups with lower socio-economic status). On the other hand, to have another job may be associated to an occupation of high socio-economic status, e.g., in the case of professional consultation work done beside the main job. If possible, on the basis of national surveys, it is recommended to report the reasons for having multiple jobs.

3b1 Night work

This indicator describes the share of employed persons who usually work at night in all employed persons aged 15+ years. The definitions of “night” vary considerably among countries, so that it is not easy to establish a strictly common basis for all. As defined for the EU-LFS, night work must be considered as work done during the usual sleeping hours. As foreseen by directive 2003/88/EC, the definition of usual sleeping hours can vary by country but, in any case, it should include hours between midnight and 5 a.m.

Methodological information on the indicator results can been seen here.

test

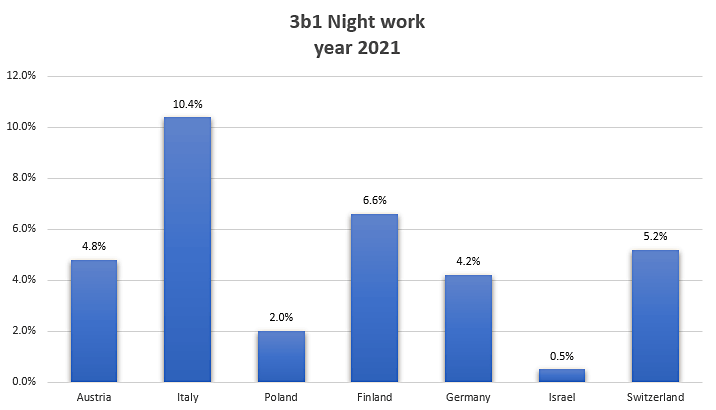
Night work can have significant impact on the health of the workforce, disturbing effects on the body’s circadian rhythms, on sleep cycles and also inducing sleep deprivation. This can cause psychological and emotional problems, including depression, stress and nervousness. In addition, night work has negative effects on family and social relationships. Night work can have a negative impact upon the work-life balance and can adversely affect physical as well as mental well-being.


National and international examples of publications on "Quality of Employment"

Using the UNECE framework, Eurostat has compiled data on employment quality for the EU countries that is provided in the Eurostat database. For more information, please visit the Eurostat website.

The list below provides examples of how quality of employment statistics are being published in different countries. 

Canada

Quality of Employment in Canada (website)

Finland

Quality of Work Life (website) 

Working Life in the Digital Age – Quality of Work Life Survey Results 1977–2018 (print)

Self-Employed Persons in Finland 2017 (print)

Working life in the digital age: enthusiasm, social support - and coping problems

Germany

Quality of Employment (website)

Quality of Employment - Earning money and what else counts 2012 (print)

Israel

Quality of Employment in the Israeli Labour Market 2001-2010 (print) 

Italy

 12 domains relevant for the measurement of well-being (website)

Sustainable Development Goals (website)

Poland

Employment quality indicators 2017 (print)

Singapore

Report: Labour Force in Singapore 2020

Switzerland

Quality of employment (English website)

Quality of employment (French website)

Quality of employment in Switzerland 2008-2018 (print)

​For more information on Quality of Employment, please contact [email protected]