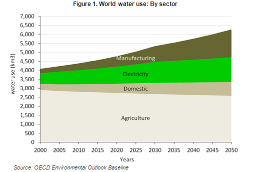
1. Show water use as total trend and as map
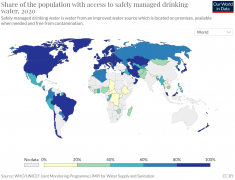
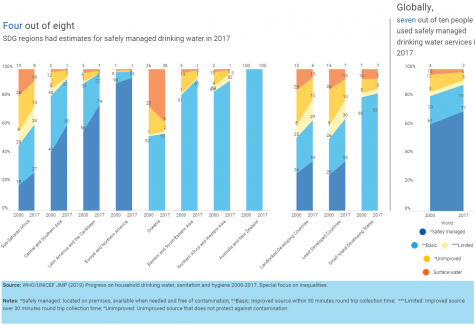
2. Show safely managed drinking water as stacked diagram
3. Showing water demand in connection with availability, and official development assistance (ODA)
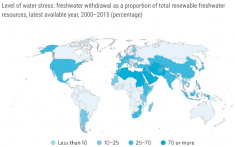
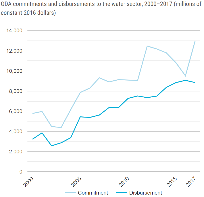
4. Depict access to so-called “improved water sources
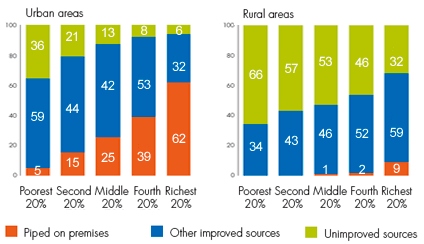
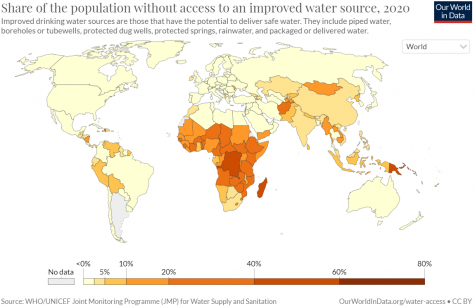
____________________________________
Sources:
- https://ourworldindata.org/water-access
https://www.oecd.org/env/resources/water-therightpricecanencourageefficiencyandinvestment.htm - https://data.unicef.org/resources/progress-drinking-water-sanitation-hygiene-2019/
- https://unstats.un.org/sdgs/report/2019/goal-06/
https://unstats.un.org/sdgs/report/2019/goal-06/ - https://www.un.org/waterforlifedecade/africa.shtml
https://ourworldindata.org/water-access = Hannah Ritchie and Max Roser (2021) - "Clean Water and Sanitation". Published online at OurWorldInData.org. Retrieved from: 'https://ourworldindata.org/clean-water-sanitation' [Online Resource]