How will urban mobility change in the aftermath of COVID-19 lockdowns? In the short term, if passengers avoid public transport due to health fears, passenger car journeys could increase significantly, which would choke cities with traffic and pollution. Many cities have been reallocating space to walkers and cyclists during the crisis and to better manage this shift as confinement measures are relaxed. Policy makers in many cities and regions are also reassessing longer-term mobility plans, with public transport set to play a strengthened role.
Public transport in many large cities is dominated by metro or tram systems, either rivalling or surpassing travel by bus (and often by passenger car). Yet until now, data on these modes of transport have not been collated in the international statistics system.
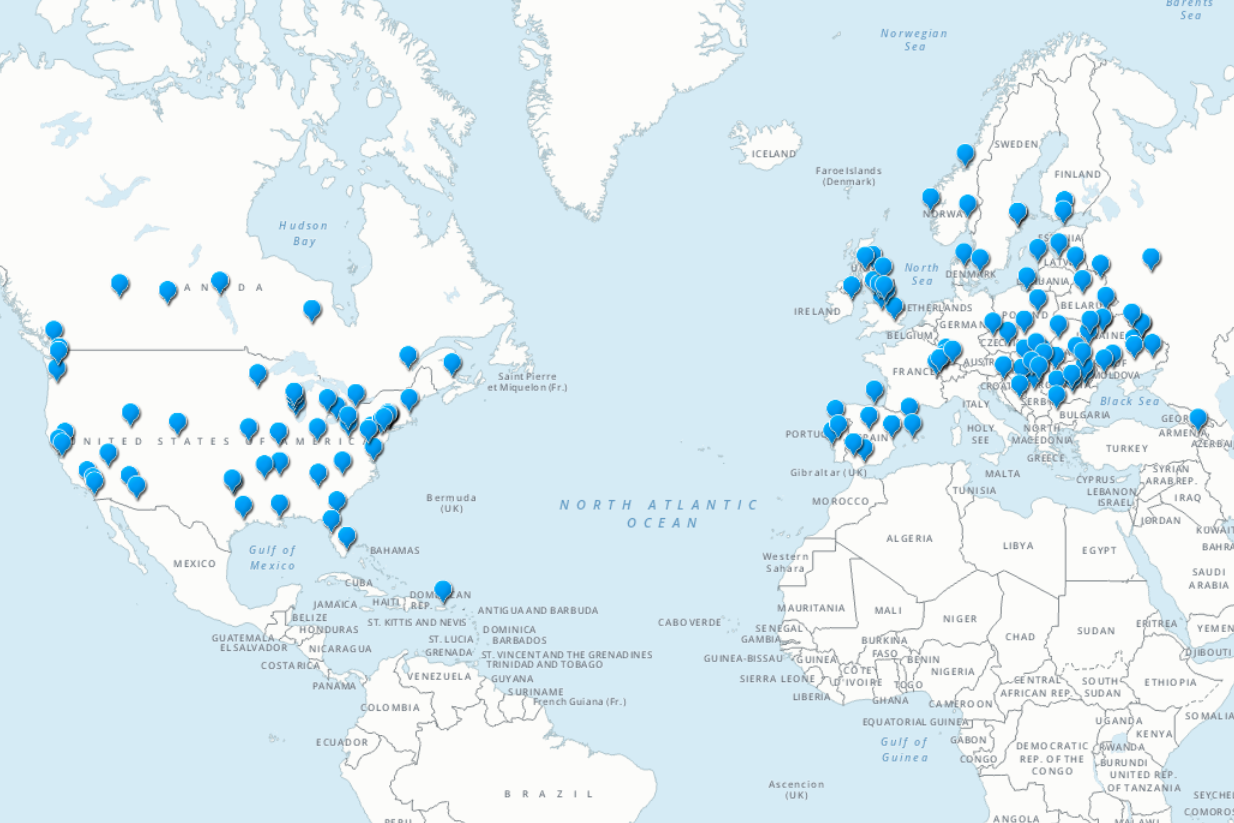
In order to support evidence-based decision making on this issue, UNECE has released a new data set with city-level figures on metro and tram networks for over 140 cities or regions, with additional data at the country level as well. The data covers passenger numbers and passenger-km per year.
Some highlights from the data:
- In London, the Underground and Docklands Light Rail are the modes that have most increased since 2010.
- Tram journeys were the second most frequented public transport mode in Latvia (after buses), beating trolleybuses, trains and air travel.
- Out of 36 metro systems, 25 saw growth in recent years whereas 11 saw decreases. London, Warsaw, Helsinki, Sofia and Cleveland all saw passenger numbers grow by more than 25%.
- For trams, the picture was more mixed. 22 cities saw passenger numbers grow, whereas 25 saw passenger numbers decrease. Among the strongest growth were cities in Sweden and Ukraine, and in the US, San Francisco and Seattle. Dublin’s tram system, which only opened in 2004, has seen a 52% increase in passenger numbers since 2010.
The data could assist policy makers in comparing the situations in cities within the same region, or of similar size. Both the passenger numbers and passenger-km figures can also be combined with data from other sources to calculate different modal share indicators at both the city and national levels. This could support analysis of policy decisions, such as to subsidize public transport in some cities.
The data are also a relevant proxy for public transport access, which feeds in to monitoring Sustainable Development Goal 11 on sustainable cities and communities (indicator 11.2.1).
The dataset was gathered following a UNECE questionnaire to governments issued in 2019. Only basic data on passenger numbers and passenger-km were requested, which keeps the data availability high for most countries, and in contrast with other UNECE transport data, the city-by-city breakdown is maintained.
However, there remain important cases where public transport data are either unpublished, collated or confidential for many cities in the region. Following the principle that public transport data should be public, UNECE will continue its efforts to improve the availability of this dataset.
These data and analysis will feed into the work to support a sustainable post-COVID-19 recovery that is being undertaken in the working parties of the UNECE Inland Transport Committee, and the Transport Health and Environment Pan-European Programme (THE PEP).
These annual data are complemented by the UNECE wiki which collates near-term data on transport, including many sources on urban transport like metros and trams.